You are building a Power Bl report that uses data from an Azure SQL database named erp1.
You Import the following tables.
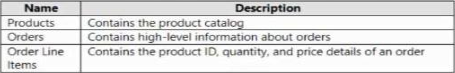
You need to perform the following analyses:
• Orders sold over time that include a measure of the total order value
• Orders by attributes of products sold
The solution must minimize update times when interacting with visuals in the report.
What should you do first?
A. From Power Query, merge the Orders query and the Order Line Hems query.
B. Calculate the count of orders per product by using a DAX function.
C. Create a calculated column that adds a list of product categories to the Orders table by using a DAX function.
D. From Power Query, merge the Order Line Items query and the Products query.
Explanation:
https://www.sqlbi.com/articles/header-detail-vs-star-schema-models-in-tabular-and-power-bi/
